

The Best UK Cities for Mental Wellbeing: Mapped

As Covid-19 cases spiked and the UK went into lockdown, mental wellbeing was thrust suddenly into the forefront of our collective consciousness. Almost two years later, people across the UK continue to report feelings of isolation, stress and anxiety, due in part to lack of socialisation and inaccessibility of mental health services.
Earlier this month, wellness experts UK Saunas launched an exclusive study to determine which areas of the UK were best for promoting mental health. The study identified five factors known to impact psychological wellbeing: the wait time to access NHS IAPT services, access to green space, access to gyms and wellness centres, and air quality. Data was then collected and analysed from 48 cities across the UK. Each city was ranked on its ability to provide an environment conducive to promoting mental wellbeing.
Key findings
 Top 10 Cities for Wellness[/caption]
 The UK's Greenest Cities[/caption]
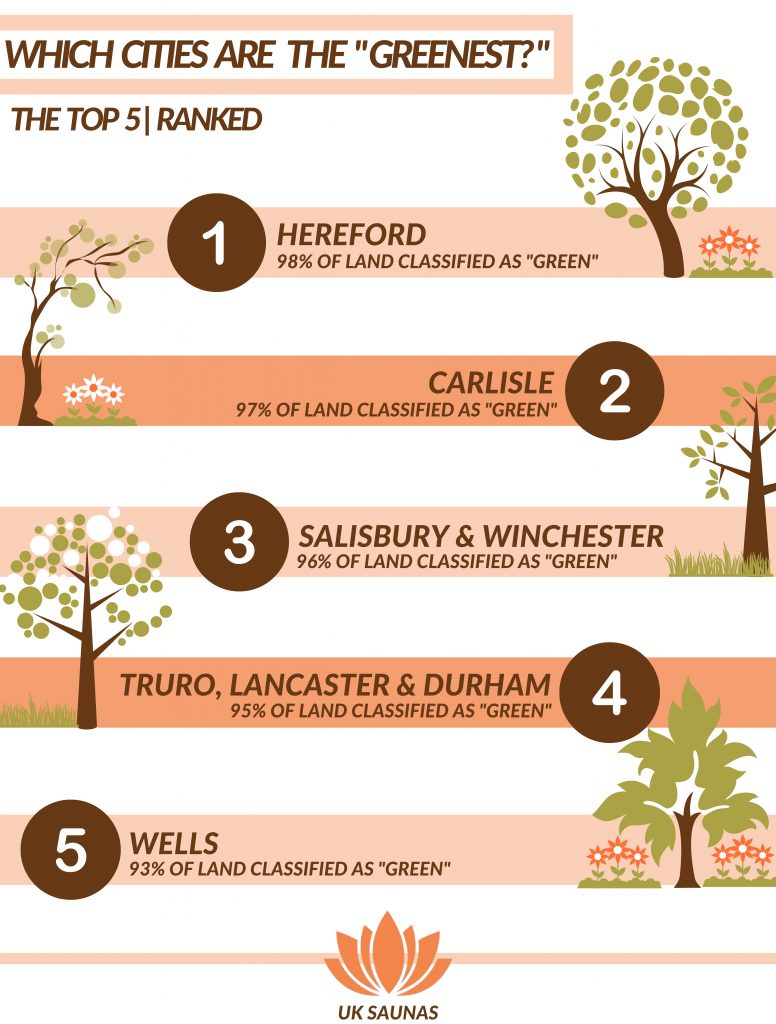
Hereford was found to be the greenest city, with only 2% of the city and surrounding area classified as “built-on”. 98% comprises farmland, natural and green urban. Hereford boasts an extensive variety of parks, forests and open spaces.
The UK's Greenest Cities[/caption]
Hereford was found to be the greenest city, with only 2% of the city and surrounding area classified as “built-on”. 98% comprises farmland, natural and green urban. Hereford boasts an extensive variety of parks, forests and open spaces.
 The UK's most Built-Up Cities[/caption]
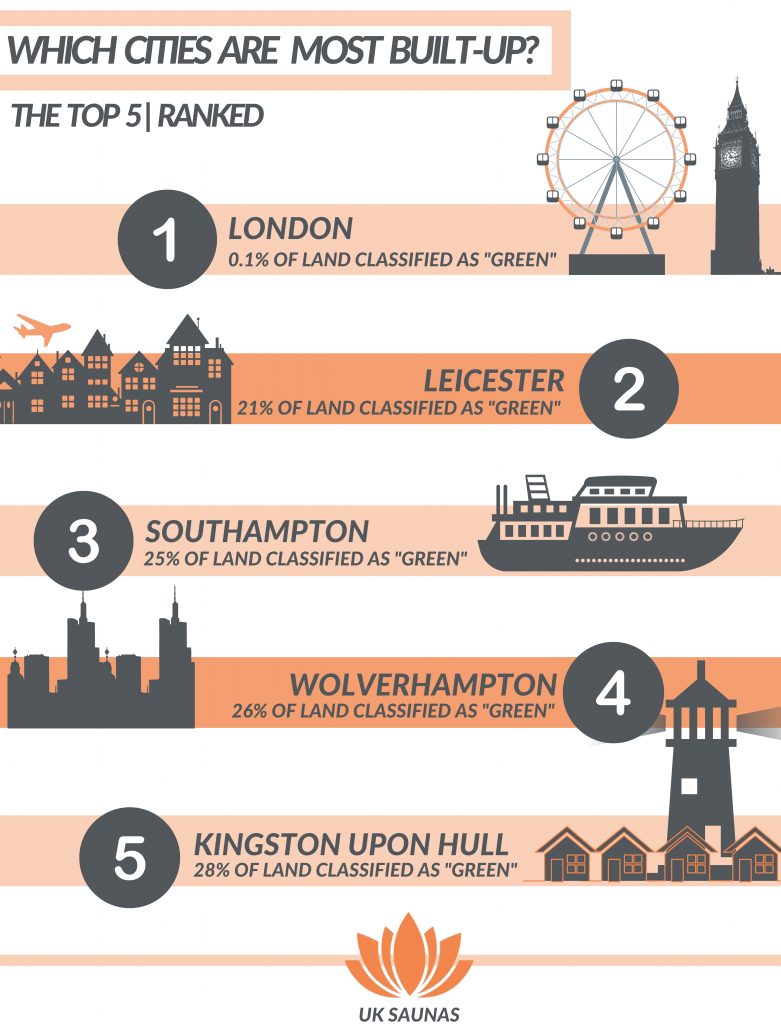
London, perhaps unsurprisingly, was found to be the most “built-up” city. Less than 1% of land can be considered as “green urban”, and there is no remaining farmland or natural land. Although London has a number of beautiful parks, they remain inaccessible to a great number of residents.
The UK's most Built-Up Cities[/caption]
London, perhaps unsurprisingly, was found to be the most “built-up” city. Less than 1% of land can be considered as “green urban”, and there is no remaining farmland or natural land. Although London has a number of beautiful parks, they remain inaccessible to a great number of residents.
 The UK's Least Polluted Cities[/caption]
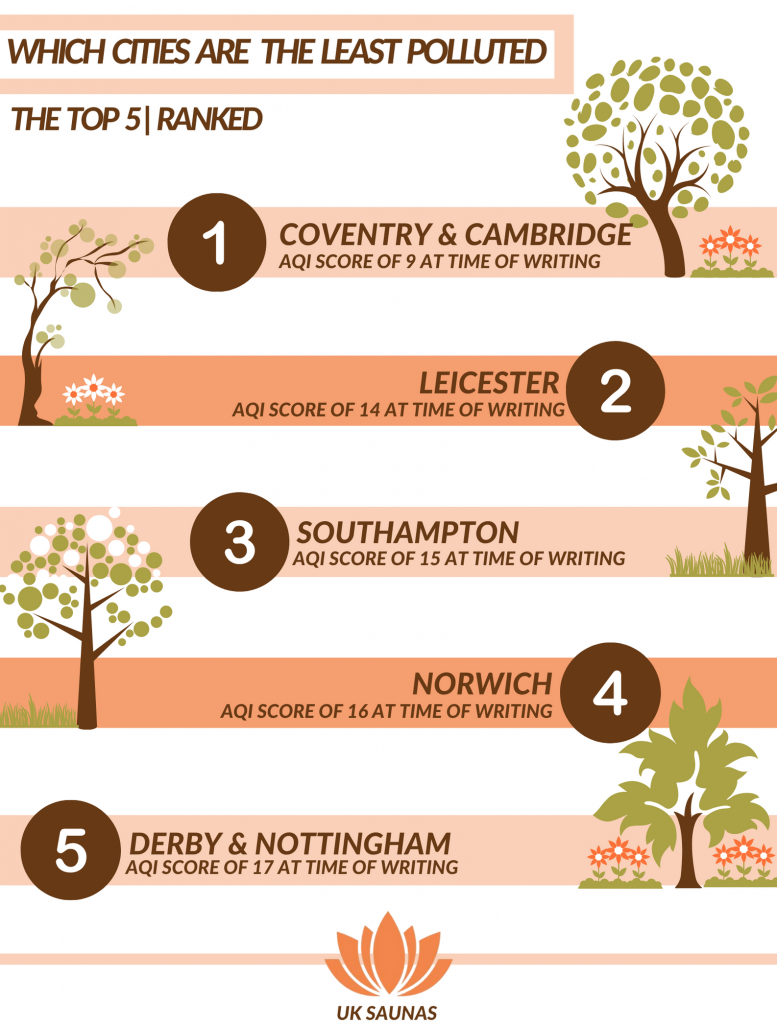
At the time of writing, the lowest levels of air pollution were recorded in Coventry and Cambridge. Both cities recorded AQI scores of 9. AQI, or air quality index, is used to measure the quality of air across the globe. The higher the AQI, the greater the level of air pollution. An AQI score below 50 signifies that pollution poses little or no risk. AQI scores above 51, however, may signify risk, particularly to more vulnerable people.
The UK's Least Polluted Cities[/caption]
At the time of writing, the lowest levels of air pollution were recorded in Coventry and Cambridge. Both cities recorded AQI scores of 9. AQI, or air quality index, is used to measure the quality of air across the globe. The higher the AQI, the greater the level of air pollution. An AQI score below 50 signifies that pollution poses little or no risk. AQI scores above 51, however, may signify risk, particularly to more vulnerable people.
 Which Cities have the Most Accessible Mental Health Services?[/caption]
Wakefield was the city with the lowest average wait time between initial referral to the NHS and first appointments, with patients waiting just 5 days before receiving a consultation with a healthcare professional. Sunderland and Oxford also ranked highly, with an average wait time of 5.1 and 7.4 days respectively.
Which Cities have the Most Accessible Mental Health Services?[/caption]
Wakefield was the city with the lowest average wait time between initial referral to the NHS and first appointments, with patients waiting just 5 days before receiving a consultation with a healthcare professional. Sunderland and Oxford also ranked highly, with an average wait time of 5.1 and 7.4 days respectively.
 Which Cities have the Least Accessible Mental Health Services?[/caption]
Bristol was the city with the highest average wait time between initial referral to the NHS and first appointments, with patients waiting 93.6 days before receiving a consultation with a healthcare professional. Wait times in Hereford and Leicester were also lengthy, with an average time of 64.5 days and 54.6 days respectively.
Which Cities have the Least Accessible Mental Health Services?[/caption]
Bristol was the city with the highest average wait time between initial referral to the NHS and first appointments, with patients waiting 93.6 days before receiving a consultation with a healthcare professional. Wait times in Hereford and Leicester were also lengthy, with an average time of 64.5 days and 54.6 days respectively.
 Cities with the most gyms per 100 000 people[/caption]
London ranked highest in this category, with 89.82 gyms per 100 000 people, a significantly higher concentration of gyms than any other city in the country. Birmingham also scored highly, with 11.49 gyms per 100 000 people. Conversely, Wells ranked lowest, with only 0.12 gyms per 100 000 people.
Cities with the most gyms per 100 000 people[/caption]
London ranked highest in this category, with 89.82 gyms per 100 000 people, a significantly higher concentration of gyms than any other city in the country. Birmingham also scored highly, with 11.49 gyms per 100 000 people. Conversely, Wells ranked lowest, with only 0.12 gyms per 100 000 people.
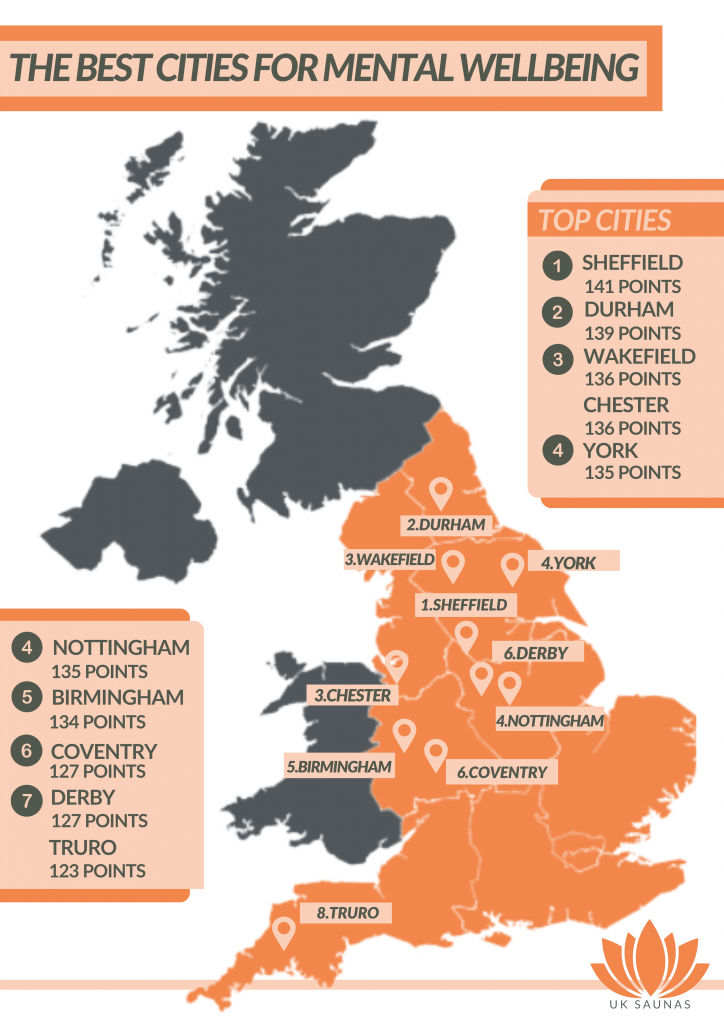
- Sheffield ranked highest overall, scoring a total of 141 points. Lincoln came last, scoring only 43 points.
- Wakefield ranked top for NHS IAPT waiting time, with prospective patients only waiting an average of 5 days prior to their initial consultation. Bristol, meanwhile, was ranked the lowest, with an average waiting time of 83.6 days. Many patients had to wait over two months following initial referral to speak to a healthcare professional.
- London, perhaps unsurprisingly, ranked lowest in terms of “green space”. Less than 1% of Londonis officially categorised as green space. Hereford ranked highest, with a massive 98% of space comprised of farmland, green urban land and natural land.
- Hull was found to have the worst air quality at the time of writing, with an AQI score of 83. Coventry and Cambridge, conversely, were found to have the best air quality, with AQI scores of 9.
- London had the highest concentration of gyms per 100 000 people, with a score of 89.2. Wells, conversely, had the lowest number of gyms per 100 000 people, scoring just 0.12.
- The West Midlands had the highest concentration of spas per 100 000 people, with a score of 2.6. The North East, meanwhile, scored the lowest, scoring just 0.7.
The Best Cities for Mental Wellbeing: Mapped
[caption id="attachment_1580" align="aligncenter" width="576"] Top 10 Cities for Wellness[/caption]
Top 20 Cities for Mental Wellbeing
| City | NHS IATP Wait Time | Green Space | Air Quality | Number of Gyms | Number of Spas | Total |
| Sheffield | 40 | 28 | 28 | 43 | 2 | 141 |
| Durham | 22 | 44 | 32 | 40 | 1 | 139 |
| Chester | 8 | 39 | 37 | 46 | 6 | 136 |
| Wakefield | 48 | 30 | 21 | 35 | 2 | 136 |
| Nottingham | 35 | 10 | 42 | 45 | 3 | 135 |
| York | 44 | 36 | 31 | 22 | 2 | 135 |
| Birmingham | 30 | 9 | 40 | 47 | 8 | 134 |
| Coventry | 19 | 18 | 48 | 34 | 8 | 127 |
| Derby | 38 | 15 | 43 | 28 | 3 | 127 |
| Canterbury | 26 | 38 | 15 | 39 | 5 | 123 |
| Truro | 31 | 42 | 41 | 2 | 7 | 123 |
| Sunderland | 47 | 25 | 18 | 32 | 1 | 123 |
| Bradford | 39 | 31 | 8 | 41 | 2 | 121 |
| Wolverhampton | 45 | 4 | 29 | 30 | 8 | 116 |
| Southampton | 37 | 3 | 45 | 25 | 5 | 115 |
| Norwich | 41 | 11 | 44 | 16 | 3 | 115 |
| Winchester | 36 | 45 | 17 | 11 | 5 | 114 |
| Hereford | 2 | 48 | 33 | 20 | 8 | 111 |
| Lancaster | 24 | 43 | 20 | 17 | 6 | 110 |
| Bath | 34 | 40 | 23 | 6 | 7 | 110 |
Spotlight on Green Spaces
Over the last two years, access to green spaces such as parks has become more vital than ever. For many, outdoor exercise was an important break from the monotony and isolation of lockdown. For many, however, green spaces remain inaccessible. A recent report, for example, indicates that around 2.5 million people live more than a ten-minute walk from a park or green space. Exercise, green spaces and mental wellbeing are intrinsically linked. Urban living is a relatively new invention, with the oldest cities only 6000 years. Only in the last decade have we become a “majority-urban” species. We have something of a natural affinity with green spaces, and they have been proved to boost joy and reduce anxiety. Some scientists even believe that they make life feel more meaningful. To highlight the importance of parks, forests and countryside, wellness experts UK Saunas ranked UK cities by volume of green space.The UK’s Greenest Cities
[caption id="attachment_1583" align="aligncenter" width="589"] The UK's Greenest Cities[/caption]
Hereford was found to be the greenest city, with only 2% of the city and surrounding area classified as “built-on”. 98% comprises farmland, natural and green urban. Hereford boasts an extensive variety of parks, forests and open spaces.
The Most Built-Up Cities in the UK
[caption id="attachment_1584" align="aligncenter" width="579"]Spotlight on Air Pollution
For decades, scientists have warned about a correlation between high levels of air pollution and deterioration of physical health. One-third of deaths from lung cancer, strokes, and heart disease, in fact, are attributed to air pollution. Recent research, however, also links high levels of air pollution with more severe mental illness. A study of 13, 000 people in London, for example, found that a relatively minor increase in exposure to nitrogen dioxide, a pollutant, resulted in an increased chance of a person requiring psychological treatment. Older research, too, links exposure to air pollution with significant increases in depression and anxiety. During Lockdown, air quality in many cities began to improve, with fewer people commuting and using public transport. Decreases in levels of nitrogen dioxide and small particle pollution were particularly evident. As commuting increases, it is unclear whether this trend will continue. Wellness experts at UK Saunas used Air Quality Index data to determine which cities were the most polluted at the time of writing.Least Polluted Cities
[caption id="attachment_1585" align="aligncenter" width="590"] The UK's Least Polluted Cities[/caption]
At the time of writing, the lowest levels of air pollution were recorded in Coventry and Cambridge. Both cities recorded AQI scores of 9. AQI, or air quality index, is used to measure the quality of air across the globe. The higher the AQI, the greater the level of air pollution. An AQI score below 50 signifies that pollution poses little or no risk. AQI scores above 51, however, may signify risk, particularly to more vulnerable people.
Cities with the Highest AQI Score at the Time of Writing
| City | AQI Score |
| Kingston upon Hull | 83 |
| Salford | 75 |
| London | 74 |
| Leeds | 74 |
| Brighton and Hove | 67 |
| Lincoln | 66 |
| Plymouth | 65 |
| Bradford | 65 |
| Manchester | 61 |
| Wells | 57 |
Spotlight on Access to Mental Health Services
The city with the highest AQI score at the time of writing was Kingston Upon Hull. Last year, Kingston Upon Hull was identified as one of the worst cities in the UK for air pollution. In a single year, the city recorded 128 deaths relating to air quality. Salford and London also ranked highly, with AQI scores of 75 and 74 respectively. In 2008, the UK launched an ambitious programme to improve mental health services across the country. In the past year, the Improving Access to Psychological Therapies (IAPT) programme has supported more than one million people nationwide and is considered to be one of the most ambitious efforts by any country to improve mental health services. The IAPT programme aims to support people with anxiety and depression, primarily with CBT, or cognitive behaviour therapy. Approximately 5.9 people per 100 currently suffer from generalised anxiety, according to mental health charity Mind. 3.3 people per 100 suffer from depression, and 4.4 people per 100 have experienced post-traumatic stress disorder (PTSD). For many people, being able to access support quickly is crucial. According to recent data released by NHS IAPT, however, there are significant discrepancies in ease of accessing mental health services across the UK. In some cities, patients experience lengthy waiting times following initial referral.Cities with the Shortest Average Wait Time Between Initial Referral and First Appointment
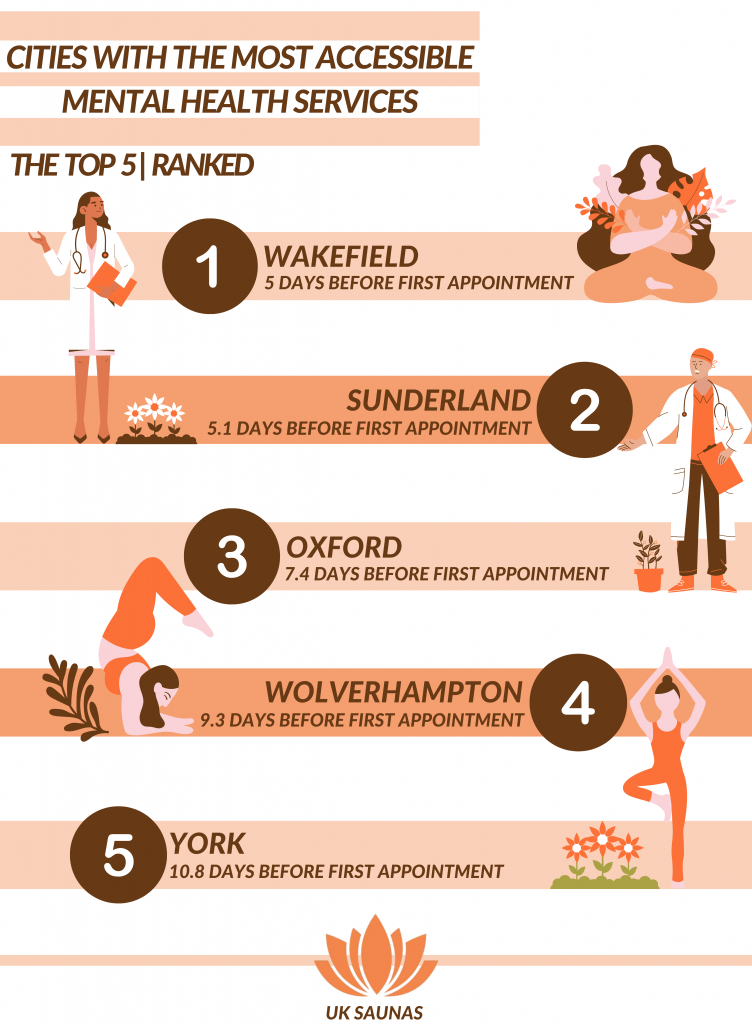
[caption id="attachment_1588" align="aligncenter" width="595"] Which Cities have the Most Accessible Mental Health Services?[/caption]
Wakefield was the city with the lowest average wait time between initial referral to the NHS and first appointments, with patients waiting just 5 days before receiving a consultation with a healthcare professional. Sunderland and Oxford also ranked highly, with an average wait time of 5.1 and 7.4 days respectively.
Cities with the Longest Average Wait Time Between Initial Referral and First Appointment
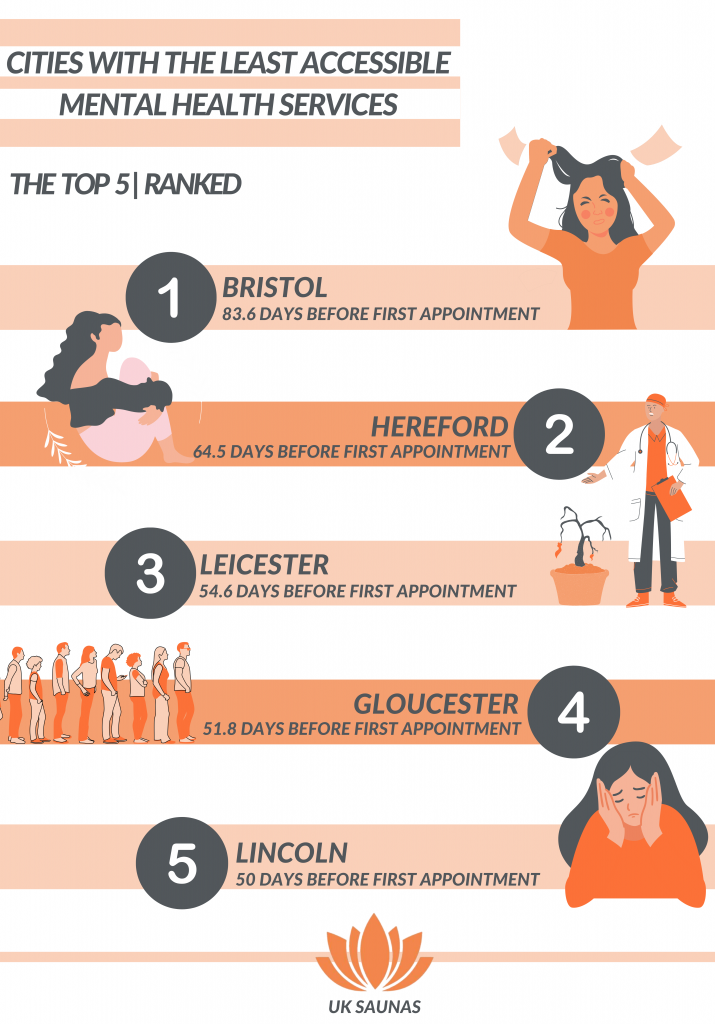
[caption id="attachment_1589" align="aligncenter" width="585"] Which Cities have the Least Accessible Mental Health Services?[/caption]
Bristol was the city with the highest average wait time between initial referral to the NHS and first appointments, with patients waiting 93.6 days before receiving a consultation with a healthcare professional. Wait times in Hereford and Leicester were also lengthy, with an average time of 64.5 days and 54.6 days respectively.
Spotlight On: Access to Gyms and Wellness Centres
Studies demonstrate that physical exercise promotes psychological wellbeing by reducing anxiety and depression and alleviating negative moods. During the pandemic, exercise equipment sales spiked by 5800%. As Covid-19 restrictions lifted, millions of people renewed their gym and leisure centre memberships. It is estimated that 7 million Brits will hold a gym membership by 2022. We looked at gym, spa and wellness centre statistics to assess accessibility across the UK.Cities with the Highest Number of Gyms Per 100 000 People
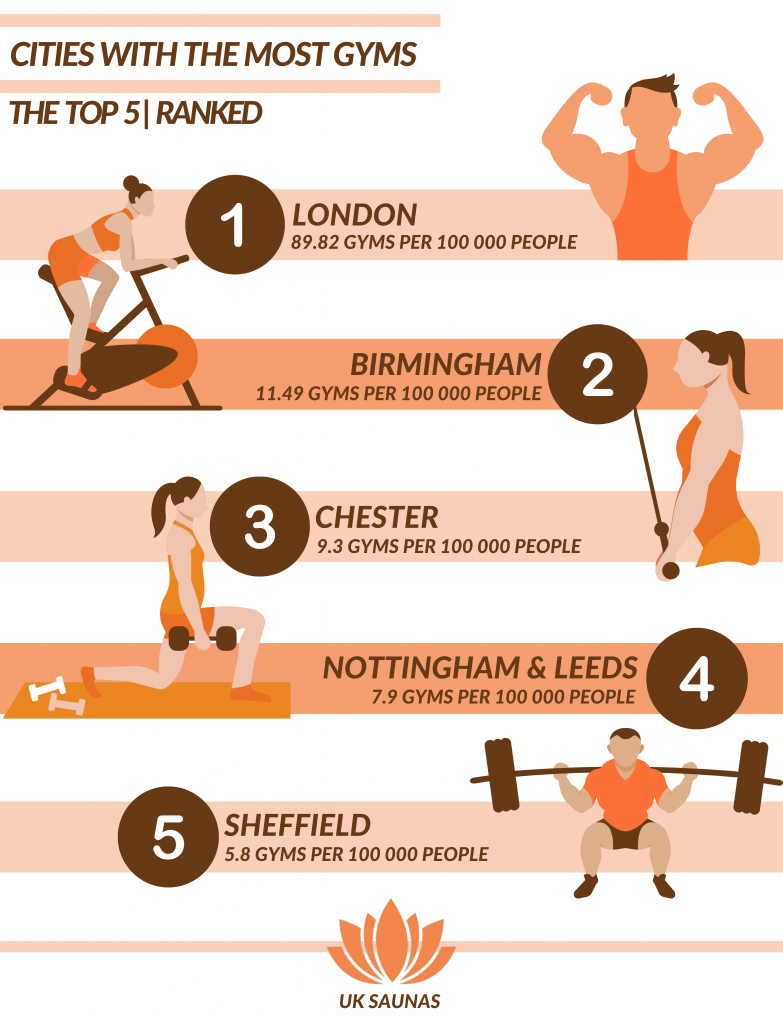
[caption id="attachment_1587" align="aligncenter" width="783"] Cities with the most gyms per 100 000 people[/caption]
London ranked highest in this category, with 89.82 gyms per 100 000 people, a significantly higher concentration of gyms than any other city in the country. Birmingham also scored highly, with 11.49 gyms per 100 000 people. Conversely, Wells ranked lowest, with only 0.12 gyms per 100 000 people.
Cities with the Lowest Concentration of Gyms Per 100 000 People
| City | Population | Gyms in directory | Number of gyms per 100 000 people |
| Wells | 12,000 | 20 | 0.12 |
| Truro | 18,766 | 34 | 0.18766 |
| Chichester | 23,731 | 64 | 0.23731 |
| Lichfield | 33,816 | 117 | 0.33816 |
| Salisbury | 45,000 | 29 | 0.45 |
| Bath | 88,859 | 163 | 0.88859 |
| St Albans | 89177 | 91 | 0.89177 |
| Lincoln | 97,541 | 57 | 0.97541 |
| Worcester | 101,328 | 67 | 1.01328 |
| Carlisle | 108,678 | 18 | 1.08678 |
Methodology
NHS IATP Data collected from: https://app.powerbi.com/view?r=eyJrIjoiNmViYTdjM2MtODk0Yi00NTAxLWE5MTUtMGJhZDVhMWM3OWI1IiwidCI6IjUwZjYwNzFmLWJiZmUtNDAxYS04ODAzLTY3Mzc0OGU2MjllMiIsImMiOjh9 (NHS Digital).- We identified which Clinical Commissioning Group represented each city and found out the mean waiting time from a patient’s initial referral to mental health service to the first appointment.
- London is represented by multiple CCGs, so we calculated an average waiting time. Each city was given a score based on the length of time between referral and treatment. Those with the fewest days scored highest.
- We used the BBC Green Space Calculator to determine the volume of green space in each city, We added the totals for farmland, “green urban” and natural land. Each city was given a score based on the total volume of green space. Those with the highest volume of green space scored highest.
- We used IQAir to determine the AQI score for each UK city. Each city was given a score based on its AQI score. Those with the lowest AQI score scored highest.
- We used the Independent Directory to calculate the number of gyms in each city.
- We used the Good Spa Guide to calculate the number of spas in each UK region. We then calculated the population of each region to find out the total number of spas and wellness centres per 100 000 people.
